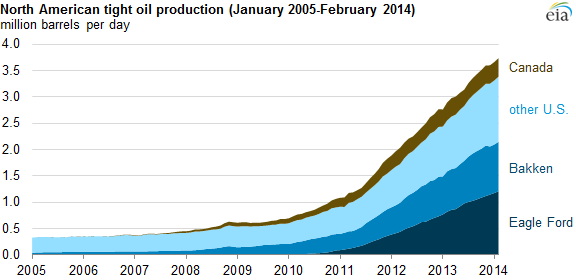
The economist Raj Chetty and his colleagues have just published a new working paper that examines spatial variation in upward income mobility across the United States. This study builds on an earlier paper they published on spatial variation in mobility. Their earlier paper first came to the attention of the media in 2013. Since then, a number of commentators have pointed out that upward mobility seems to be particularly high in areas with hydraulic fracturing (commonly known as "fracking"). For example, the highest upward mobility rate in the country was observed in Bowman, North Dakota, which is adjacent to the heavily fracked Bakken shale.
Chetty and colleagues' latest paper investigates the causal effect of growing up in a particular area on an individual's future income. Their method was to calculate, for individuals with parents at the 25th percentile of the national income distribution in each of 718 commuting zones, "the percentage increase gain (or loss) in income at age 26 from spending one more year of childhood in a given commuting zone relative relative to the national mean". They calculated such figures for both household income at age 26 and individual income at age 26. Here I examine whether, measured this way, upward mobility does in fact tend to be higher in areas with fracking.
Chetty and colleagues' preferred estimates of the causal impact of growing up in different commuting zones (CZs) were downloaded from the Equality of Opportunity Project's webpage. I divided CZs into those located in fracking states, and those located in non-fracking states. Fracking states were defined as those in which >1,000 fracking wells have been drilled since 2005, namely: Arkansas, Colorado, Louisiana, New Mexico, North Dakota, Oklahoma, Pennsylvania, Texas, Utah, West Virginia, and Wyoming. I then ranked CZs from highest to lowest causal impact, separately for household income at age 26 and individual income at age 26 .
The first chart (below) plots the percentage of CZs at a given rank or higher located in fracking states against rank on household income causal impact. Overall, 27% of CZs are located in fracking states, which is why the line tails off to 27% on the right-hand side. The marked uptick on the left-hand side indicates that CZs located in fracking states are overrepresented at the highest ranks. 32% of the top 50 CZs are located in fracking states, 45% of the top 20 are located in fracking states, and 50% of the top 10 are located in fracking states.

The picture is even clearer in the second chart (below), which plots the percentage of CZs at a given rank or higher located in fracking states against rank on individual income causal impact. Here, 26% of the top 50 CZs are located in fracking states, 45% of the top 20 are located in fracking states, and 60% of the top 10 are located in fracking states.

However, closer scrutiny of the two lists of rankings revealed that nearly all the highest ranked CZs located in fracking states happened to be located in North Dakota. When North Dakota was excluded from the rankings, there was no longer any tendency for CZs located in fracking states to be overrepresented at the highest ranks. Thus, it is possible that it is not fracking per se that gives rise to high upward mobility, but something specific to North Dakota.
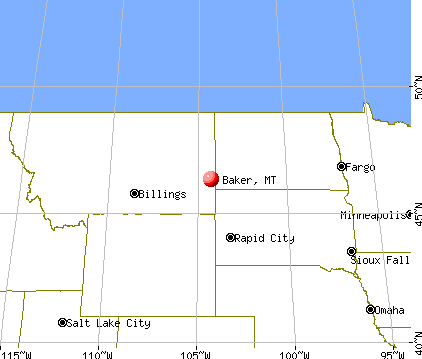
On the other hand, there may be a considerable number of high ranked CZs outside of but adjacent to fracking states where many individuals employed in the fracking industry live. For example, Baker, Montana, which has the second highest household income upward mobility, is located right on the border with North Dakota, next to the Bakken shale. A more fine-grained analysis would assign fracking status separately to each CZ based on the number of individuals employed in the fracking industry there or some other suitable measure.
No comments:
Post a Comment